We started the project with a list of 60+ criteria that were jotted down on various lined pages. There were multiple teams to manage, multiple ways to order their effectiveness, different managers, and a schedule that needed constant attention. The director knew there was a better system that needed to be implemented, but didn’t have the time or expertise to put something into place. Moreover, other vendors proposed solutions that were custom code-based and required outside resources in the event that anything needed to be modified in the future.
Our solution was to build an intuitive production dashboard that was easy to understand by field operators and managers alike. Additionally, the system was built on a familiar platform, which ultimately saved the client time, frustration, and money.
Even intuitive systems can still seem daunting at first. That’s why we finished our implementation by providing a demonstration and training to get everyone ready and feeling comfortable with the new process.
Project
Dashboard
Client
Top 5 Company In Industry
What We Did
Excel Dashboard, Custom Implementation, Presentation
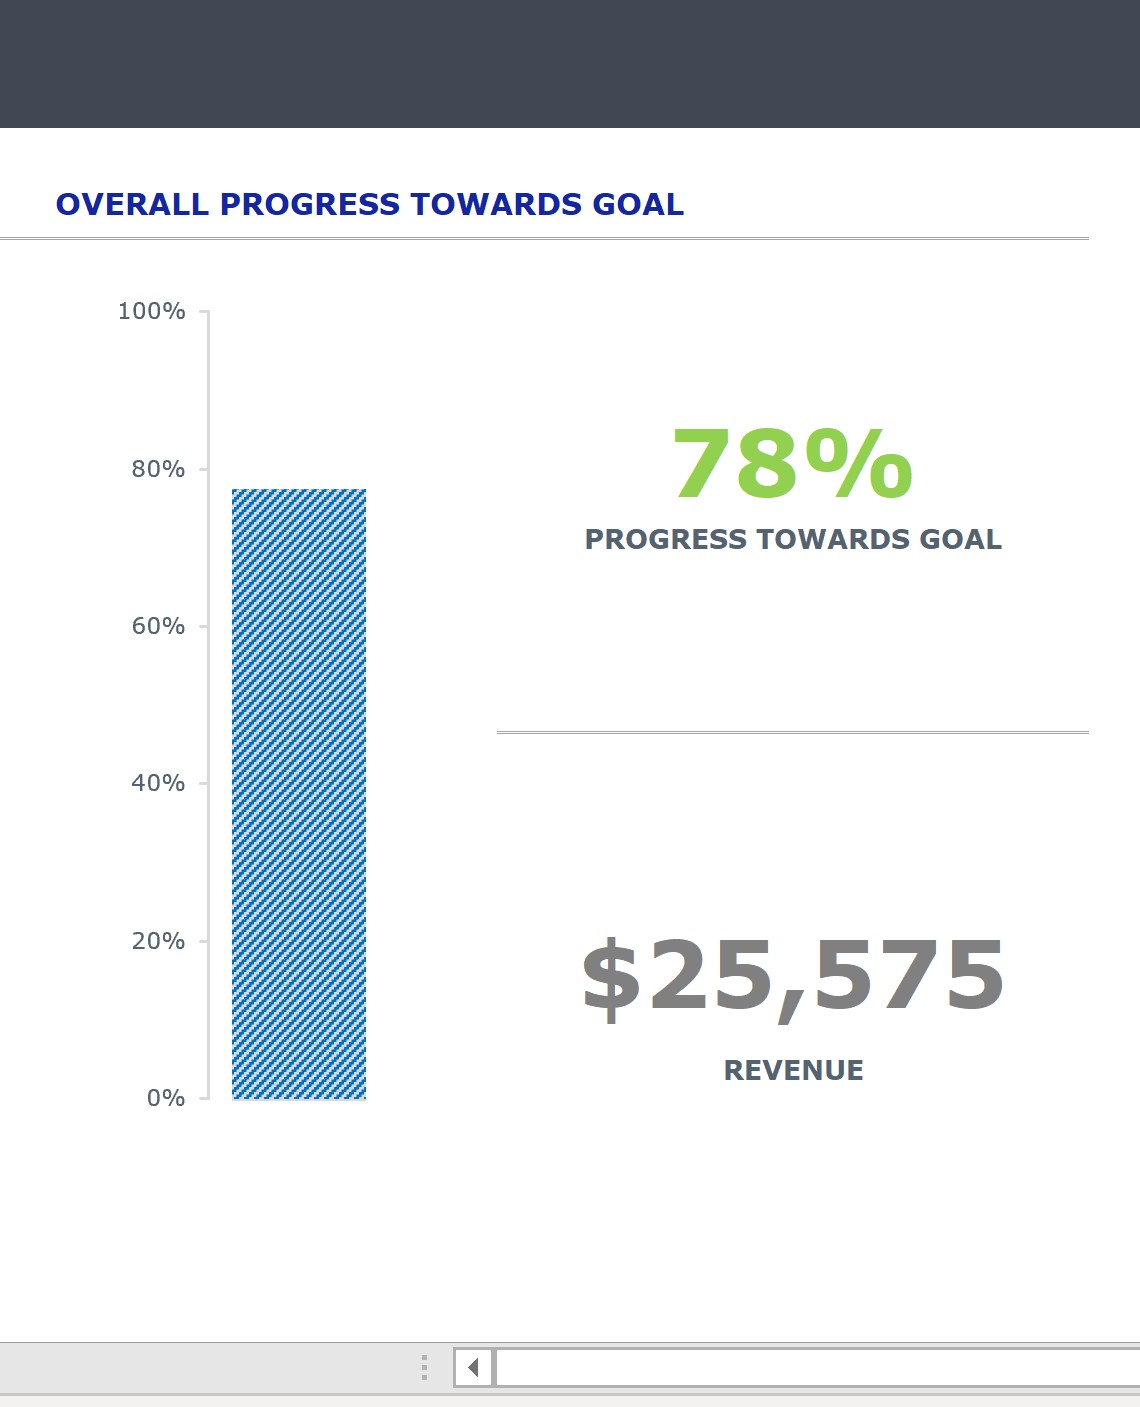
Visual Goal Setting
Let’s Make Measuring Effectiveness Easy
In every industry, measuring effectiveness is a key component to long-term success. Being able to visualize your progress helps to give perspective on how close your teams are to hitting their targets. Haggard Newman dashboards show dynamic graphs of your progress, the percentages change color as they get closer to their goal, as well as the real revenue dollars.
Getting Organized
If You Measure It, They Will Come
Unlike Field of Dreams, just building something is no guarantee of success. The currency in business today is data, and your buying power is information; without them you can’t identify trends, insights or definitive ways to achieve your goals. Not sure measuring data makes a big difference? Check out this study from McKinsey: Achieving Business Impact With Data